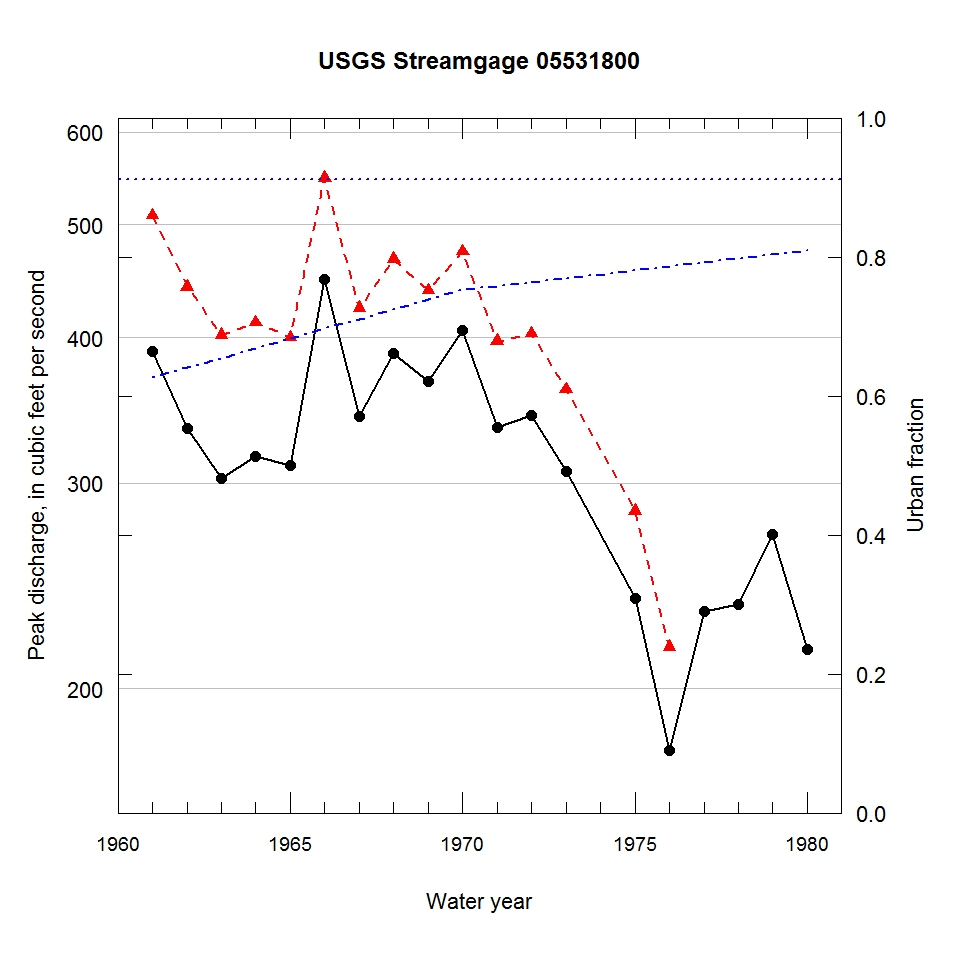
Observed and urbanization-adjusted annual maximum peak discharge and associated urban fraction and precipitation values at USGS streamgage:
05531800 ADDISON CREEK AT NORTHLAKE, IL


| Water year | Segment | Discharge code | Cumulative reservoir storage (acre-feet) | Urban fraction | Precipitation (inches) | Observed peak discharge (ft3/s) | Adjusted peak discharge (ft3/s) | Exceedance probability |
| 1961 | 1 | -- | 0 | 0.627 | 1.699 | 389 | 509 | 0.212 |
| 1962 | 1 | -- | 0 | 0.641 | 0.226 | 334 | 442 | 0.342 |
| 1963 | 1 | -- | 0 | 0.655 | 1.312 | 303 | 402 | 0.447 |
| 1964 | 1 | -- | 0 | 0.669 | 1.089 | 316 | 412 | 0.423 |
| 1965 | 1 | -- | 0 | 0.683 | 0.583 | 311 | 400 | 0.451 |
| 1966 | 1 | -- | 0 | 0.697 | 2.072 | 449 | 548 | 0.173 |
| 1967 | 1 | -- | 0 | 0.711 | 0.946 | 342 | 424 | 0.391 |
| 1968 | 1 | -- | 0 | 0.725 | 2.387 | 388 | 467 | 0.281 |
| 1969 | 1 | -- | 0 | 0.739 | 1.371 | 367 | 439 | 0.349 |
| 1970 | 1 | -- | 0 | 0.753 | 2.757 | 406 | 474 | 0.266 |
| 1971 | 1 | -- | 0 | 0.758 | 0.376 | 335 | 397 | 0.460 |
| 1972 | 1 | -- | 0 | 0.764 | 1.573 | 343 | 403 | 0.444 |
| 1973 | 1 | -- | 0 | 0.770 | 0.498 | 307 | 361 | 0.551 |
| 1975 | 1 | -- | 0 | 0.781 | 1.504 | 239 | 284 | 0.769 |
| 1976 | 1 | -- | 0 | 0.787 | 1.782 | 177 | 217 | 0.921 |
| 1977 | 0 | -- | 685 | 0.792 | 1.612 | 233 | -- | -- |
| 1978 | 0 | -- | 685 | 0.798 | 1.274 | 236 | -- | -- |
| 1979 | 0 | -- | 685 | 0.804 | 0.841 | 271 | -- | -- |
| 1980 | 0 | -- | 685 | 0.809 | 0.836 | 216 | -- | -- |

